The first post in this series made one claim: the harness is the architecture. Orchestration, fallbacks, tool routing, all the things teams used to hand-tune in prompts, became structure you could rely on. Reasoning got durable. The knowledge that reasoning ran over did not. Ask an agent the same spec question twice and you could get two different answers, depending on which chunks the retriever surfaced and what happened to land in the context window. It would contradict itself across two turns of the same conversation. Nothing errored. Every check was green. The answer just wasn’t the same twice, and no one could point to why.
That is the gap this post is about. Those relationships were never stored: this motor needs that valve; this part replaces the discontinued one; this spec came from that PDF table. They were re-derived at inference time, implicit, approximate, and rarely identical from one run to the next.
01 · THE GAP
Where the harness still fell short
The harness solved orchestration. Knowledge itself stayed opaque: vector chunks with no entities, no relationships, no lineage.
Retrieval finds text that looks relevant, not facts that are true.
That traversal is the product. A chunk store can’t do it, no matter how good the embeddings are, because the relationships were never stored. They get re-inferred on every query, from whatever text the retriever happened to surface.
But the brand already has an API, why not just call it?
Sometimes, yes. For a brand with a good, stable API, the graph should not copy the catalog. It records how to use the API: which route answers which question, what to pass, how to read the response, and what to do when it returns nothing. On Brand H, an API-backed brand, we compared the two approaches directly. Resolving shopper phrases to categories through the live API got all 17 right. A stored copy of the category tree got 13 right and 4 wrong, and it will only drift further as the catalog changes.
An API returns records; the graph returns relationships.
For everything else, an API gives you records and not relationships. Most brands spread their real knowledge across a catalog API, a specs API, PDF datasheets, cross-reference data and rules held by the brand’s own experts. No single endpoint returns "this motor requires this drive, which works with these controllers, and this one is discontinued, so here is its replacement." The graph materializes those relationships once, so the agent traverses them instead of re-inferring them on every request.
A brand’s knowledge also doesn’t stop at the brand’s own borders. Some of what a customer needs lives with competitors, and some lives in sources the brand never thought of as its own. No single API covers that, however good it is. The graph can, because it is built from wherever the knowledge actually sits. Everything it takes in is stored as part of this brand’s graph, scoped to this brand, and carries a record of where it came from. A competitor’s part, for example, becomes this brand’s own node, never another brand’s.
One graph, many sources, under one tool. A brand’s real knowledge is never in one place. KCS folds all of it into one graph with one shape: API records, declared facts, documents and other sources, normalized into the same entities and relationships, each carrying its own lineage: where it came from, whether it was declared or inferred, and how confident we are. The agent doesn’t learn five APIs and reconcile five auth flows and five schemas. For the brand’s catalog knowledge it queries one tool over one graph, and every fact answers the same way, with lineage attached. Real-time, non-catalog lookups, a contact, a live web search, stay separate tools.
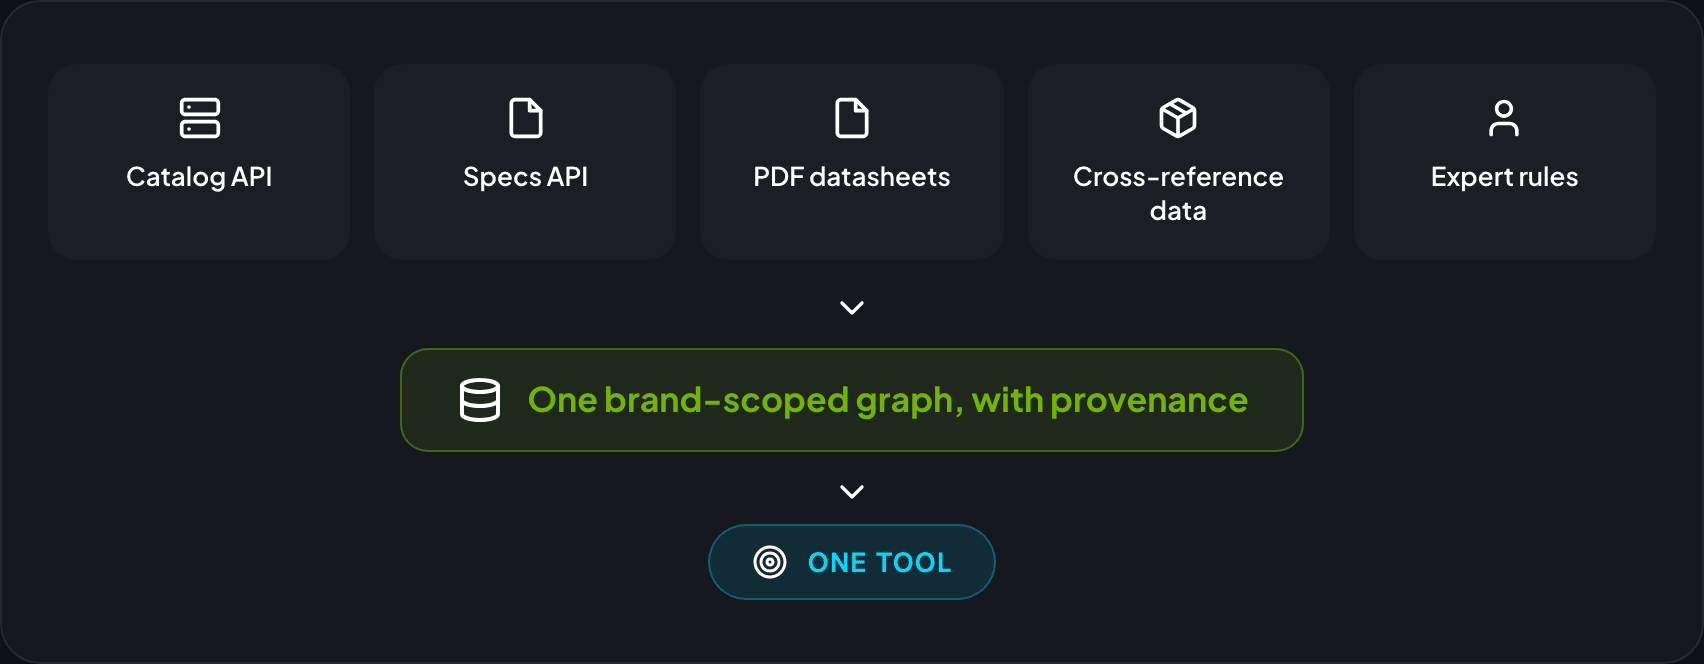
KCS digests the difficulty so the agent doesn’t have to. Everything hard about the outside world (portals that restrict automated access, JS-rendered spec tables, per-size PDF failures, pagination, rate limits, inconsistent field names, contradictory sources) is absorbed once, at build time, by the build and the people driving it. What reaches the agent is the finished product: precise, structured, verified information it can act on directly. The agent’s job is to reason about the customer’s problem.
That is what KCS is: the layer that eats the external mess so the agent receives clean, navigable truth.
02 · BUILD VS QUERY
Why we didn’t just fetch at query time
The obvious alternative to a pre-built graph is to ground answers by reading the brand’s portal or documents live, at query time. Where a brand has a good API we route to it (see above). For knowledge that lives in pages, documents and images, we built KCS because live reading doesn’t hold up. Two failure classes, both observed on real brands.
Fragility
Grounding at query time depends on brand portals that restrict or rate-limit automated access, which makes them unreliable dependencies for a customer-facing query. A build-time process can throttle its requests, ask the brand for authorized access, or work from documents the brand has openly published.
Re-derivation
Even when the live read succeeds, you’re asking the model to rebuild structure from raw text on every request: which fields are specs, which string is the part number, how this product relates to that family, which document backs which claim. That work requires inference, with three properties that make it a poor fit for the hot path.
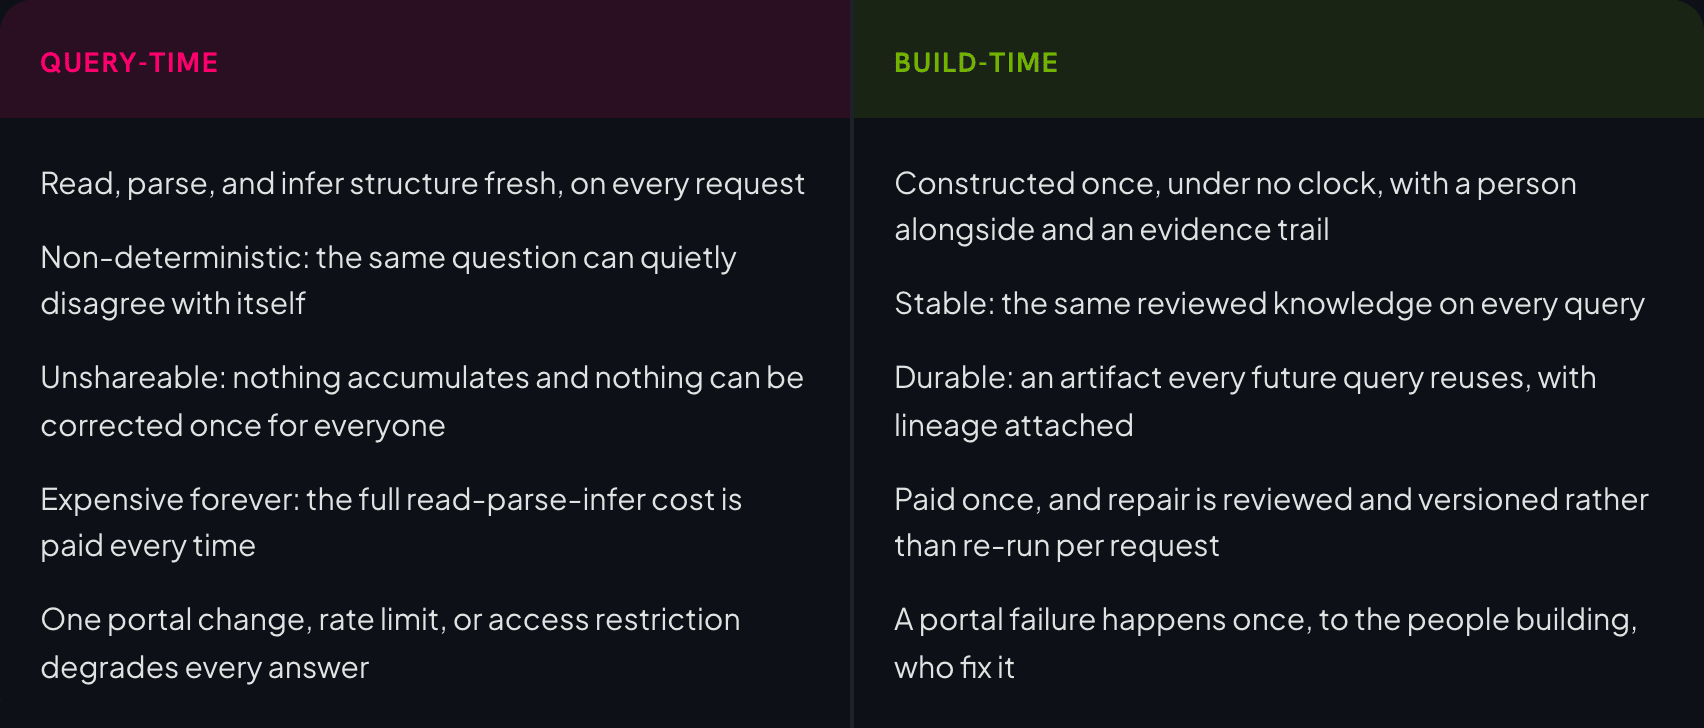
Non-deterministic
The same page, read twice, does not reduce to the same structure twice: retrieval surfaces different chunks, the model reads them in a different order, a decoded table lands slightly differently. Two users asking the identical question, or the same user across two turns, can get answers that quietly disagree, with nothing in the logs to explain why. In our cross-brand index, 13.2% of question and model combinations got different verdicts across three identical asks. The knowledge was never fixed; it was re-guessed each time.
Unshareable
Because the structure only exists for the duration of one request, nothing accumulates. There’s no artifact a second query can reuse, no place to attach provenance, no ground truth a person can review and correct once for everyone. Every request starts from zero and every request can be wrong in a new way.
Expensive, forever
You pay the full read-parse-infer cost on request one, and again on request one million. The work is identical each time and thrown away each time.
Build-time construction collapses all three. You derive the structure once, under no clock, with people and the audit (section 4) watching; you write it down as entities and relationships with provenance; and you freeze it. After that, each query reads reviewed data, insulated from whatever the portal happens to return in that moment. The knowledge is the same every time, and when it’s wrong you fix it in one place instead of hoping the next roll of the dice comes up right.
Large documents make this acute
A lot of a brand’s real knowledge lives in PDF catalogs, and parsing one live, inside a query turn is the worst place to do it.
- It’s slow and it doesn’t fit. You cannot read, parse, and reason over that inside one turn without blowing the context window and the latency budget. The document has to be chunked, and now you’re back to retrieval finding text that looks relevant (section 1), on the fly, under a clock.
- It’s not reproducible. PDF extraction is lossy and order-sensitive: the same document parsed twice yields slightly different tables, different field boundaries, different debris. So the same question over the same catalog returns a different answer depending on which parse the model happened to get. That’s exactly the "not the same twice" failure this post opens on, imported straight into query time.
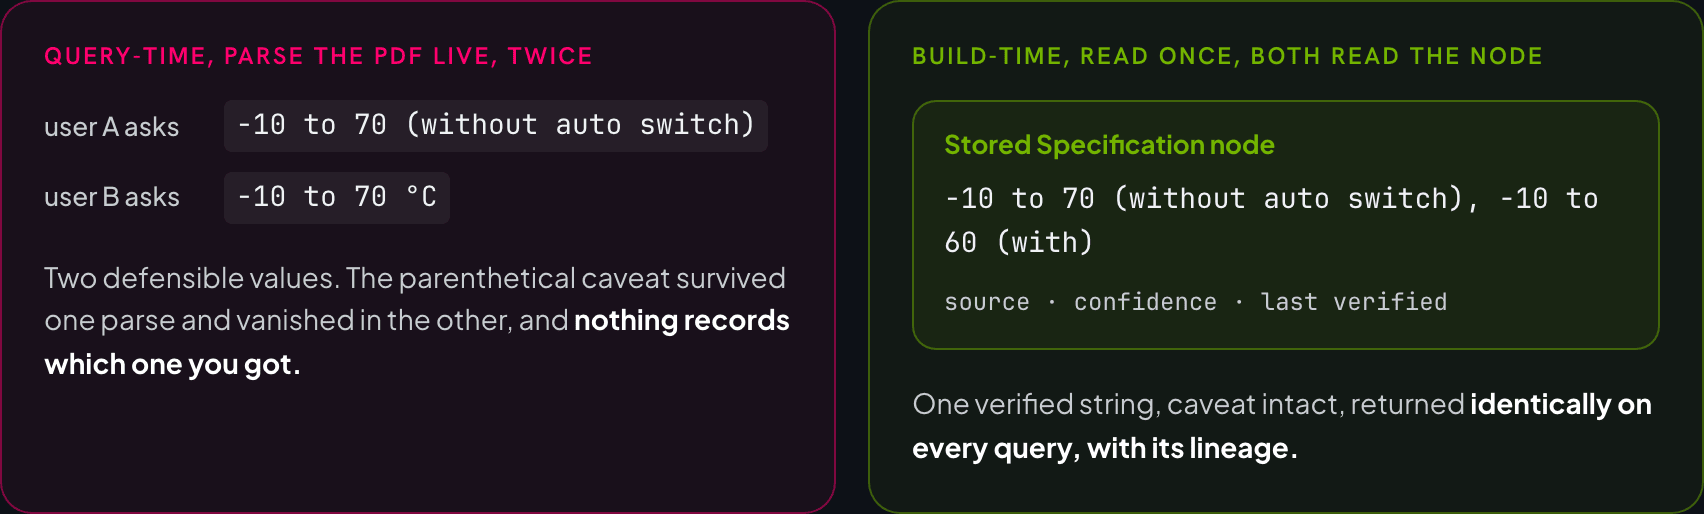
- Quality is a coin flip. Recall the Brand A value
Ambient and fluid temperature -10 to 70 (without auto switch), -10 to 60 (with auto switch). Getting that parenthetical right requires a careful, verified extraction. Done live under pressure, the caveat is the first thing that gets dropped, and a dropped caveat is a wrong spec delivered with full confidence.
Build time inverts all three: parse the 717k-character catalog once, extract the specs carefully, verify them against the audit (section 4), store them as structured nodes with provenance, and freeze. Every query afterward reads the same verified value. No re-parse, no drift, no coin flip.
03 · HOW WE BUILD
How we build the graph
So build it once, at build time. But how? Two obvious answers both fail.
By hand doesn’t survive contact with scale. Nobody is hand-authoring that graph, and nobody is keeping it current by hand when the catalog moves.
An unsupervised agent fails differently, and worse, because it fails silently. An agent handed a portal and a graph will confidently write a plausible structure that is wrong in ways nobody sees until a customer gets a bad answer.
What works sits between the two: an agent that does the heavy lifting, with a person alongside it, and evidence for everything it writes.
What the first version taught us
Our first approach split construction across several specialized agents, each handing a summary to the next. It gave us discipline, but it also fragmented context. No one held the whole picture, and the process was hard for a person to follow or steer.
The next version puts one agent in charge of a brand build, holding the full context, working alongside a person. Three principles carry over from the first version:
- Humans stay in the loop. The agent explains what it is doing, and a person can steer it and sign off on decisions that matter.
- Every fact has lineage. Where it came from, and how sure we are.
- Reasoning happens on the real content. Not on a rigid recipe written in advance.
How we build depends on what a brand offers. Where a good API exists, the graph points to it and doesn’t copy it. Where it doesn’t, we construct the knowledge from the sources that do exist.
Several agents, each passing a summary to the next. Discipline, but no one holds the whole picture.
One agent, one full picture, a person alongside.
Two rules we don’t bend
Every write stays inside one brand. Every fact carries where it came from, whether it was declared or inferred, and how confident we are. These rules exist to catch silent corruption. On Brand D, valid relationships were quietly dropped during a build. Nothing errored, and a person noticed the gap much later, which is the worst way to find out. We changed the system so this kind of failure is caught while the write happens.
Scale matters too
Moving from per-item to batched construction made large builds roughly an order of magnitude faster.
Measured across a full brand build.
THE GRAPH ITSELF
What a finished brand graph looks like
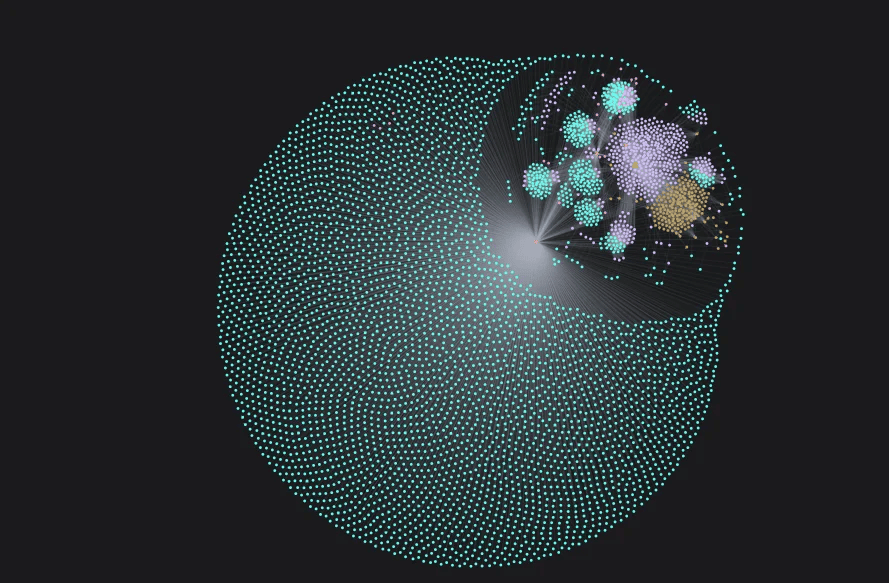
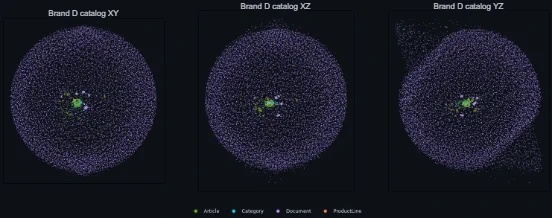
A durable graph is an artifact you can point at. This is the Brand D graph as it stands, rendered from the same data the agent queries.
Reading it in three dimensions
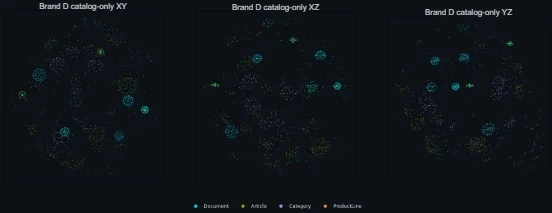
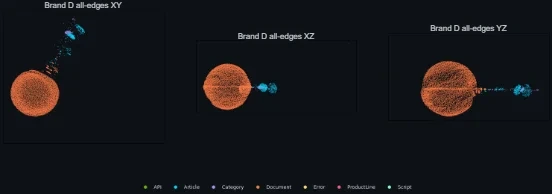
We are also testing 3D renders of the same graphs. Same data, different instrument: cluster density and the shape of a product family are easier to see when the layout has somewhere else to go.
04 · THE AUDIT
The build is only as good as what you can prove
The most consistent lesson across real brand builds is that a finished-looking graph may still contain serious gaps. Reviewing the first Brand F build turned up 24 issues, and one comment summed them up:
"Everything looks green, but the data is wrong."
Those particular defects are history, the graph has been rebuilt since. The important question is how they survived a successful build. A process can only report on itself. Every stage returned success and nothing in the run disagreed, because nothing in the run was standing outside it.
So we measured the same graph again months later, in a single snapshot. Every figure in this section comes from it.
The recurring failures fall into four shapes across brands:
One value where the source had several
A document covering a whole product family got stored as if it described one product. Nothing about the stored value shows it was a choice.
The right type, the wrong meaning
A value is valid and searchable but means something other than what a customer is asking about. A range query over it silently ranges over the wrong thing.
Self-reported confidence
The system marked its own output as verified, and it was not. The flag may be sincere, but it is a self-report rather than a measurement.
A source that degrades in translation
The graph holds a faithful record of a lossy reading, and no check inside the graph can catch it, because the graph never saw the original. A source’s network rules blocked our first reader, so we swapped it. The harder version of this problem is the one where the read succeeds but the conversion flattens a table or loses a figure.
Provenance is the instrument that makes the graph testable. Every data node in that graph carries its lineage. Complete lineage, and the data can still be wrong, which is exactly the point of having it. A value with perfect lineage can still be derived from the wrong place. That defect was findable in one query only because the evidence was stored next to the value.
Green records a moment; durable confidence requires continuous verification. The build report from early August recorded zero orphans, on a graph that held 2,289 nodes at the time. That was true. The graph kept growing incrementally across months, the way a real brand graph does, to the 2,603 nodes measured above. In that later snapshot, 176 of its 333 document nodes hung off nothing at all: no product, no section. Some were corporate paperwork that belonged nowhere. Others were manuals and catalogs unreachable from any product a customer would ask about. One of them is titled Ambient Temperature, a spec row that became a document.
An audit that runs once is a photograph of a graph that no longer exists. A gate that runs at the end of a build cannot see what the next write does, so a defect recorded in one audit can persist across later measurements untouched.
Brand A: a clean build, start to finish
Specs pulled from the PDFs, not inferred:
That last value, the caveat preserved in parentheses, is the tell that the table was actually read. The Brand A audit came back clean on every check. Same process, same green, opposite truth, and the difference is entirely in what was verified rather than what was reported.
What an unproven fact costs
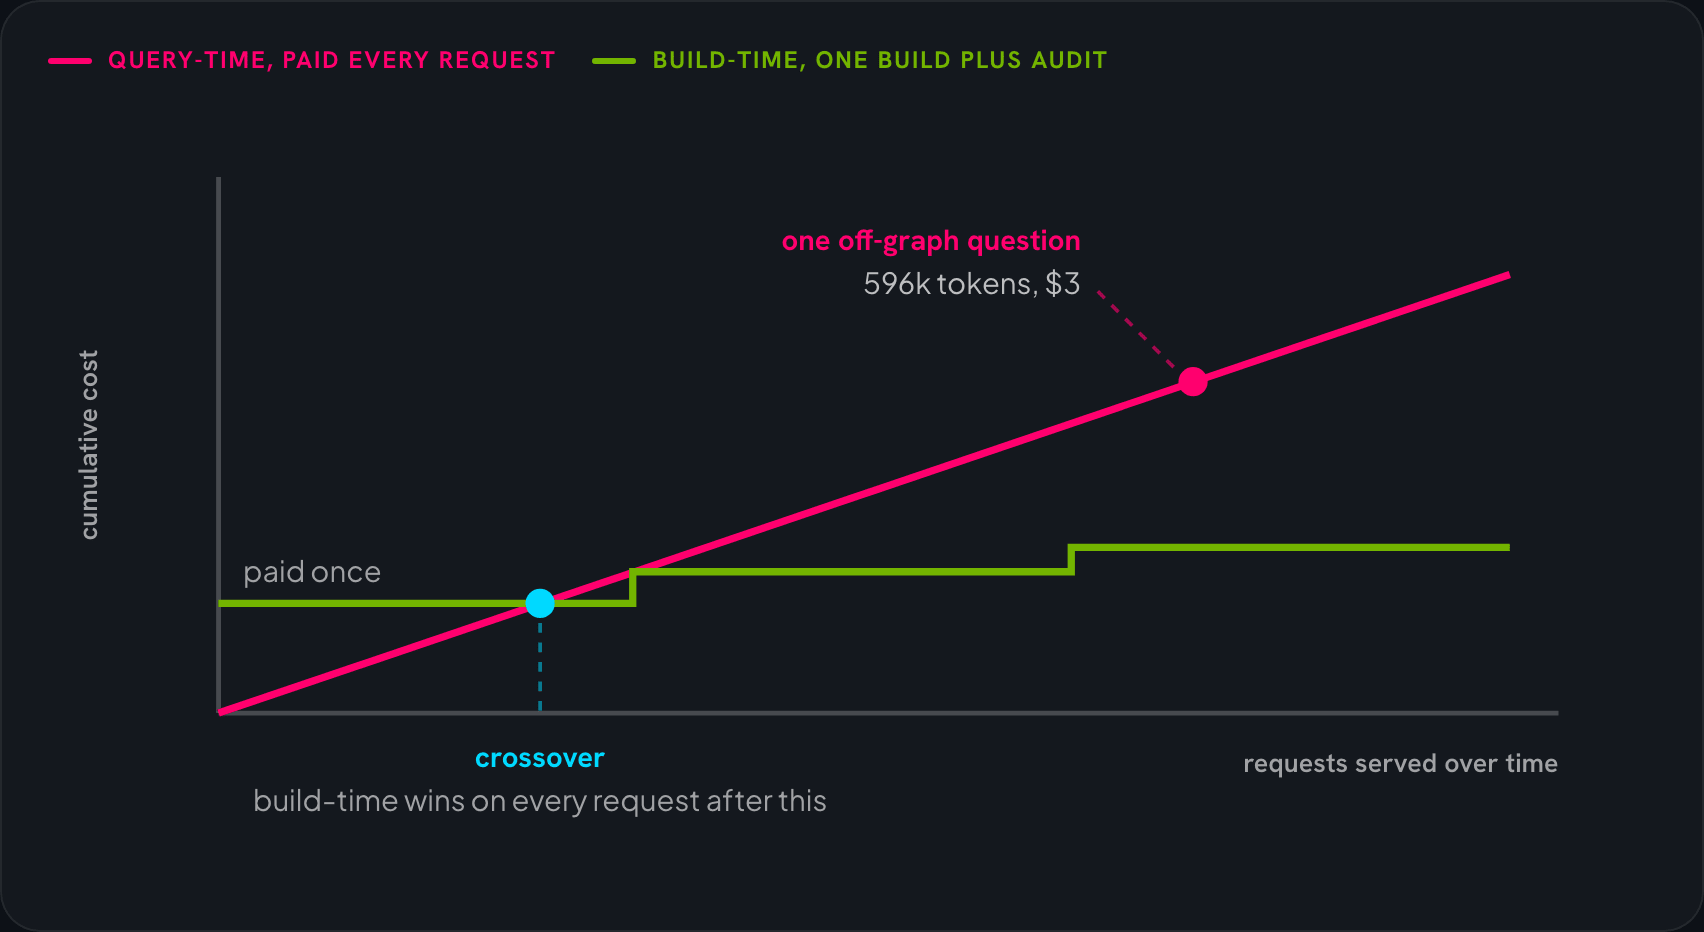
The failure isn’t only a wrong answer. Ask the Brand F agent about a product whose power ratings never made it into the graph and it does the reasonable thing: it goes and reads the catalog.
one catalog dropped into context takes a turn from 17k tokens to 596k, and that fallback path has hit $3 for a single question
nobody chose to spend the difference, and no dashboard flagged it, because from the outside the agent looked like it was working
A coverage hole nobody could see is a bill somebody pays per question, and the audit is what converts it back into a one-time engineering cost. None of these defects failed a build. They were found by pointing an instrument at a finished graph and asking it to prove itself, one query at a time.
A build is finished when something outside it says so, never when the build does.
05 · REPAIR
Degrading gracefully, for a graph
Graceful degradation was the first post’s throughline. A durable graph needs the same discipline turned on itself: when the graph is wrong, the repair has to be as engineered as the build. A hotfix on a live graph adds a second unreviewed change on top of the first.
Plan
Show what would change before anything changes
Apply
Apply it through the same controlled path as construction
Verify
Check what is actually there, not whether totals match
So repairs follow the same discipline as construction: show what would change before anything changes, apply it through the same controlled path, and check the result by what is actually there, not by whether the totals match. Matching totals can hide wrong rows. Work in progress stays invisible to everyone else until a person approves it, and anything that is rejected leaves no trace. Every version of a graph can be reproduced and, if needed, restored.
The rule underneath all of it: nothing overwrites anything without being seen doing it.
We are making this path simpler for the people running a build, so a correction doesn’t need its own project each time.
Build-time pays for construction once. It has to pay for repair once, too, reviewed, versioned, provable, or the second payment is where all the trust from the first one leaks out.
06 · THE ARGUMENT
Build-time vs. query-time, the core argument stated plainly
Everything above is one argument made five ways. Stated once: for knowledge that has to be constructed, an agent should navigate what was built before the question arrives, keeping construction off the user’s waiting path. Where a brand’s own API already answers the question well, the graph’s job is to route to it.
Put the two designs side by side. Same user, same question, same brand. The only thing that moves is when the knowledge gets assembled.
The same question, asked twice
One Brand A spec, two readings. Only one design gives the same answer both times.
Where the two designs cross
Cumulative cost as requests pile up. Build-time pays up front, then stays flat.
07 · RESULTS AND METRICS
Results and metrics
Two sets of measurements, and they answer different questions. The first is a cross-brand index we published separately. The second is a closer look at three brand graphs.
The cross-brand index. 100 questions written from 14 manufacturer catalogs, across five query types, sent to three frontier models, bare and, where the provider allows it, with web search. Each question was asked three times. GPT-6 Astra is the comparison model named throughout. Tested in September 2026.
Web search lifted scores roughly three to four times, and even the best configuration fell short: GPT-6 Astra with search got 46 of 100 questions right, 12 partly right (counted as half, for its 52.0%), and 42 wrong. Search finds pages. It does not check that the page is current or describes the right product.
What the index does and does not show. The reference answers are ReshapeX’s own answers, verified by our engineers against manufacturer documentation, and they were correct on all 100 questions. That makes them the yardstick, not a competitor scored on equal terms. ReshapeX also ran on older model versions than the ones tested. We think the knowledge layer explains the gap, but the index was not designed to test that. The Brand B comparison below is the controlled version of that question. Full report: reshapex.com/iaai2026.
A closer look at three brands
Three brand graphs, measured the same way. The comparison model throughout is GPT-6 Astra with web search enabled, tested in September 2026.
| Measure | Brand A | Brand B | Brand C |
|---|---|---|---|
| Accuracy, graph | 100% | 100% | 100% |
| Accuracy, GPT-6 Astra with web search | 45% strict / 57.5% lenient | 62.5% | 58% |
| Same-agent, no-graph arm | not available | 68.8%, graph is the only variable toggled | not available |
| Latency, graph vs no-graph | graph ~3.6x slower | graph ~1.2x slower, still faster than frontier with web at the median | graph slower at the median |
| Dev time, graph vs non-graph | ~2 days vs ~5 days est. | ~1 week vs ~3 weeks, repeats per brand | ~8 days vs ~8 days |
| Completeness, breadth | 99.7% pages / 83% products | 100% products | 74.3% products / 83.3% categories |
| Completeness, depth (specs) | 24.6% of series | 77.1% overall, one sub-catalog at 0% | 68.4% of products |
Accuracy is the clean result. The graph-backed agent answered correctly on all three brands, against 45 to 62.5% for GPT-6 Astra with web search on these three brand sets. Across the 14-catalog index, the best frontier configuration with search reached 52.0%. Brand B is the tightest read, because the same agent was run with and without the graph and nothing else changed: 100% with it, 68.8% without.
Brand A carries two figures for the comparison model because two grading rules give two different answers. Strict counts an answer correct only when every part of it is right and supported: the part number, the spec value, the availability claim, and a source that actually says so. Lenient also accepts an answer that identifies the right product or reaches the right conclusion while getting a secondary detail wrong or leaving it uncited. The graph-backed agent scores 100% under both rules, so the two numbers appear only on the comparison side, where the gap between them, 45% against 57.5%, measures how often the model was directionally right and specifically wrong.
Read that accuracy next to the depth row below it, because the two describe different things and the pairing is easy to misread. Accuracy is measured over a question set, not over the catalog. On Brand A the question set was answerable from the graph as built, so 100% means the agent was right every time it was asked about the part of the catalog the graph covers, while spec depth says that part is 24.6% of the brand’s series. The claim is correctness within coverage, not coverage itself. Breadth and depth are what the graph knows; accuracy is how reliably it answers from what it knows. A brand’s remaining series need building before a question about them can be asked at all, which is why the completeness numbers stay in this table next to the accuracy ones.
Latency is the honest trade, and the graph is the slower path. Against the same agent without a graph, the graph-backed run is about 3.6x slower on Brand A, about 1.2x slower on Brand B, and slower at the median on Brand C. The graph fixes the knowledge, not the agent’s output: the agent still reasons, and the traversal still costs time. Brand B is the reference point worth keeping: even at 1.2x, it still answers faster at the median than a frontier model with web search, because a traversal replaces a live crawl.
Dev time is not a uniform win. Brand C took about as long as the non-graph route, and Brand F was rebuilt after its first audit. Building a graph pays back on accuracy and reuse, not on the first build’s calendar.
Completeness remains uneven. Breadth, how much of a brand’s own catalog structure the graph represents, runs high across all three, mid-70s to 100%. Depth, the specs, documents and price data attached to each product, lags well behind that, and unevenly even within one brand: Brand B’s 77.1% aggregate spec coverage hides a specific sub-catalog sitting at 0%, invisible until you look underneath the average. None of this is "done." It’s the first cross-brand evidence the durable-graph bet pays off, with the gaps named instead of hidden, and Brand C’s result rounds out that pattern.
08 · FINAL WORDS
Final words
The graph didn’t remove the harness’s need for judgment. It gave that judgment something solid to stand on: a structure it can navigate instead of re-deriving from scratch every time the question changes. Context is the architecture; the graph is where durable context comes from.
The payoff shows up when you measure it. Across all three brands benchmarked in section 7, the graph-backed agent answered the hard question sets correctly 100% of the time, where a frontier model with web search landed between 45 and 62.5% on those sets and no higher than 52.0% across the 14-catalog index, missing exactly the things a live search gets wrong: discontinued parts, live stock, and cross-references between brands. On Brand B, where the graph was the only variable toggled on an otherwise identical agent, the no-graph arm scored 68.8% against the graph arm’s 100%, which attributes the gain to the graph rather than the surrounding harness. The 14-catalog index was not designed to isolate that; this comparison is. And the graphs behind those runs took two to eight days each to build, with no rebuild needed to reach those scores.
None of that is the finish line. A graph is only worth building if what sits on top of it can be trusted, and proven. The next post is about that layer: how agents query the graph, and how we measure, brand by brand, whether it earns its place against a frontier model on the brand’s own catalog.
The durable graph is the foundation; what we build on it is where the value gets delivered.